Your boss wants to know if your content is winning in the age of AI. Your spreadsheet with scattered metrics from five different tools isn’t cutting it anymore. Welcome to the dashboard dilemma—where traditional analytics tools can’t tell you what AI engines are doing with your content.
Building custom AI search dashboards isn’t just about pretty visualizations. It’s about creating a single source of truth that reveals whether ChatGPT, Perplexity, and Google’s AI Overviews are amplifying your brand or burying it beneath competitors.
Table of Contents
ToggleWhat Are Custom AI Search Dashboards?
Custom AI search dashboards are centralized reporting interfaces that aggregate, visualize, and track your content’s performance across generative AI platforms.
Think of them as mission control for the AI era. Instead of toggling between Google Analytics, Search Console, and manual AI query tests, you get one unified view showing exactly where your content appears, how often it’s cited, and how you compare to competitors.
According to Gartner’s 2024 research, 70% of enterprises will be using generative AI applications by 2025, yet fewer than 15% have proper measurement frameworks in place. That gap? That’s your opportunity.
Why Traditional Dashboards Fail at AI Visibility Tracking
Google Analytics shows you traffic. Search Console shows rankings. Neither tells you that ChatGPT cited your competitor 47 times this month while mentioning you zero times.
Traditional AI metrics reporting tools weren’t designed for a world where answers come without clicks. They measure the old game while an entirely new competition unfolds invisibly.
Your CFO sees declining organic traffic and questions your content investment. Meanwhile, your brand awareness is actually growing because Perplexity cites you as the industry authority. Without proper dashboards, you can’t prove that value.
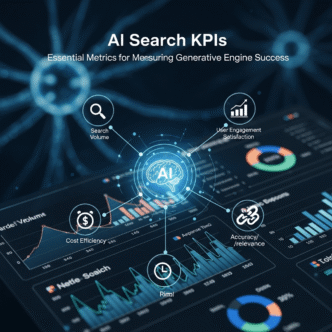
Essential Components of AI Search Dashboards
Citation Volume and Frequency Metrics
Track how many times AI platforms reference your content across specific query sets. This becomes your North Star metric for AI visibility.
Break this down by platform (ChatGPT vs. Perplexity vs. Claude vs. Google AI Overviews) and time period. Weekly trending matters more than absolute numbers initially.
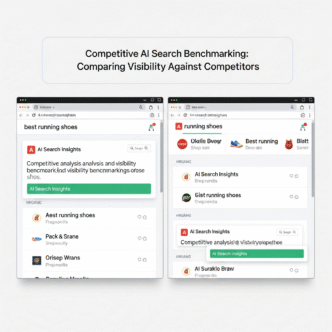
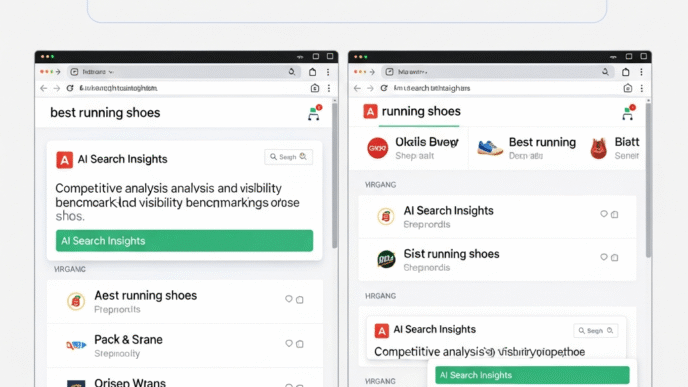
Share of Voice Across Generative Engines
What percentage of AI citations in your niche belong to you versus competitors? This visibility reporting dashboards metric reveals market position more accurately than traditional rankings ever did.
If you’re at 8% share of voice while your main competitor sits at 34%, you’ve got a concrete target for improvement. No guesswork required.
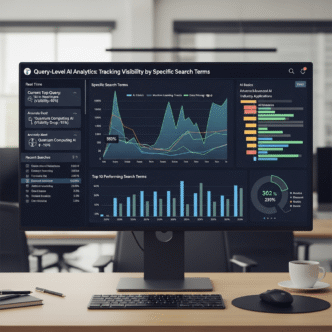
Query-to-Citation Mapping
Which specific queries trigger citations of your content? These are your AI-era “ranking keywords,” except the outcomes matter more than positions.
Map citation performance against search volume to prioritize optimization efforts. High-volume queries with zero citations? That’s where you focus next.
Citation Context and Sentiment
Not all citations are created equal. Being cited as “What not to do” differs dramatically from “Industry best practice.”
Your dashboard should categorize citations by context: positive authority reference, neutral mention, comparison to alternatives, or critical perspective. This qualitative dimension separates sophisticated tracking from mere counting.
How to Build Custom Dashboards for AI Search Tracking
Step 1: Define Your Core Metrics
Start with the five metrics that actually matter to your business goals:
Primary Citation Rate – Total citations per 100 queries in your domain. Competitive Citation Ratio – Your citations versus top 3 competitors combined. Platform Distribution – Percentage breakdown across AI platforms. Topic Authority Score – Citation frequency by content category. Citation-to-Traffic Correlation – How citations influence direct and branded traffic.
Don’t overcomplicate. Five meaningful metrics beat 50 vanity numbers every time.
Step 2: Establish Data Collection Infrastructure
You’ll need data pipelines from multiple sources:
Manual query testing for platforms without APIs (most AI chatbots currently). Automated web scraping for platforms like Perplexity that display citations publicly. API connections to Google Search Console for AI Overview data. Integration with AI search visibility tracking tools for comprehensive monitoring.
Tools like Python with Beautiful Soup, Selenium, or Puppeteer handle the collection. Schedule these to run daily or weekly depending on budget and data needs.
Step 3: Choose Your Dashboard Platform
Google Data Studio (Looker Studio) – Free, familiar, integrates easily with Google ecosystem. Limited customization for advanced visualizations but perfect for most teams.
Tableau – Enterprise-grade with powerful visualization capabilities. Steep learning curve and cost, but unmatched for complex data relationships.
Power BI – Microsoft’s answer, strong for organizations already in Azure ecosystem. Better at handling large datasets than Data Studio.
Custom Built (React + D3.js or similar) – Maximum flexibility but requires developer resources. Only worthwhile for agencies or enterprises with specific needs.
Step 4: Design for Actionable Insights
Pretty charts mean nothing if they don’t drive decisions. Structure your dashboard in three tiers:
Executive Summary View – 5-7 key metrics at the top showing health at a glance. Traffic light system (red/yellow/green) for quick status assessment.
Analytical Deep Dive – Detailed breakdowns by platform, query type, competitor, and content category. Allow filtering by date range, topic, and other dimensions.
Tactical Action Items – Automated alerts for significant changes. Highlighted opportunities where competitors are gaining ground. Lists of underperforming content needing optimization.
Comparison: Dashboard Building Platforms
| Platform | Cost | Learning Curve | Customization | AI Data Integration | Best For |
|---|---|---|---|---|---|
| Looker Studio | Free | Low | Medium | Manual/API | Small-medium teams |
| Tableau | $70+/month | High | Very High | API/Database | Enterprises |
| Power BI | $10+/month | Medium | High | API/Database | Microsoft shops |
| Custom React/D3 | $5k-50k dev | Very High | Unlimited | Custom | Agencies/Large orgs |
| Excel/Google Sheets | Free | Very Low | Low | Manual | Getting started |
Advanced Dashboard Features That Matter
Competitive Intelligence Overlays
Don’t just track your performance—overlay competitor data directly on the same charts. See your citation trajectory against the top 5 competitors simultaneously.
According to SEMrush data, companies that benchmark against competitors in their dashboards make 2.3x faster optimization decisions. Context is everything.
Predictive Trend Analysis
Implement basic machine learning models that forecast citation trends based on content publishing velocity, topic coverage, and competitive activity.
When your dashboard predicts you’ll lose share of voice in Q4 based on competitor content calendars, you can preemptively adjust strategy. That’s the difference between reactive and strategic management.
Attribution Modeling for AI Traffic
Connect AI citations to downstream business metrics. Track users who searched your brand after encountering you in AI responses, even if they never clicked the citation.
This requires UTM parameter sophistication and multi-touch attribution modeling. Complex? Yes. Valuable? Absolutely. It answers the ROI question executives actually care about.
Content Performance Heatmaps
Visual representations showing which content pieces get cited most frequently across different query types and AI platforms.
These heatmaps reveal patterns invisible in table views. You might discover how-to content dominates ChatGPT citations while your data-driven reports own Perplexity references. That insight shapes content strategy immediately.
Real-World Dashboard Implementation Success
Case Study: Enterprise SaaS Company
A $200M ARR project management platform built a comprehensive custom GEO dashboards system tracking 500 core queries across four AI platforms.
Within three months, their dashboard revealed a critical insight: while they dominated traditional search for “project management software,” competitors had 4:1 citation advantage in AI platforms for the same queries.
They reallocated 30% of content budget toward AI-optimized comprehensive guides. Dashboard tracked the impact in real-time: citation rate increased 240% over six months, and branded search volume grew 67% despite declining traditional organic traffic.
The dashboard paid for itself in the first month by preventing misguided panic about traffic declines.
Case Study: Healthcare Content Publisher
A medical information site serving 40M annual visitors built custom dashboards tracking health query citations across AI platforms—critical given the life-or-death nature of accurate health information.
Their dashboard incorporated citation accuracy scoring, flagging when AI platforms cited outdated or contradicted content. This led to a systematic content refresh program that increased citation rate from 12% to 41% share of voice in their niche.
More importantly, they documented improved accuracy in how AI platforms presented their medical information, creating competitive differentiation in accuracy and trustworthiness.
Essential Metrics Every AI Dashboard Needs
Citation Velocity
How quickly are your citations growing or declining? This trend metric matters more than absolute numbers early on.
Calculate week-over-week and month-over-month percentage changes. Set alerts when velocity drops below thresholds, triggering immediate investigation.
Query Coverage Percentage
Out of your target query set, what percentage actually triggers any citations of your content?
If you’re tracking 200 queries but only 23 (11.5%) generate citations, you’ve got massive opportunity. This metric guides content gap analysis better than any keyword research tool.
Average Citation Position
Similar to SERP position, where your citations appear in AI responses matters enormously. Being the first source cited converts better than fourth position.
Track this across platforms and query types. Some topics may require different optimization approaches based on position performance patterns.
Multi-Platform Presence Rate
What percentage of queries cite your content across multiple AI platforms simultaneously?
High multi-platform presence indicates truly authoritative content that diverse AI systems trust. This metric identifies your strongest content to amplify and model future creation after.
Common Dashboard Building Mistakes
Data Overload Paralysis
The biggest mistake? Tracking everything possible instead of everything useful.
New dashboard builders often create 40-metric monstrosities that nobody actually uses. Start with 5-7 core metrics, validate they drive decisions, then expand carefully.
If a metric doesn’t change your behavior, delete it. Ruthlessly.
Ignoring Data Quality Issues
Garbage in, garbage out remains the eternal truth of analytics. If your data collection methods have gaps or inconsistencies, your dashboard lies convincingly.
Implement data validation checks. Compare manual spot-checks against automated collection monthly. Trust, then verify repeatedly.
Building Without User Input
Who uses your dashboard? What decisions do they need to make? Building dashboards in isolation from stakeholders guarantees beautiful but useless reports.
Interview your dashboard users before designing anything. What questions keep them up at night? What would make their jobs easier? Design for those needs specifically.
Static Design That Never Evolves
The AI landscape changes monthly. Your dashboard from six months ago probably measures the wrong things today.
Schedule quarterly dashboard reviews. What new platforms emerged? Which metrics proved meaningless? What new questions arose? Evolve continuously or become irrelevant quickly.
Technical Architecture for Scalable Dashboards
Data Layer: Collection and Storage
Set up dedicated databases (PostgreSQL or MongoDB work well) to store AI citation data separately from traditional analytics.
Structure tables for: Citations (platform, query, date, position, context), Queries (keyword, search volume, category, intent), Competitors (domain, citation count, share of voice), Content (URL, title, publish date, category).
This normalized structure enables flexible analysis without rebuilding data pipelines constantly.
Processing Layer: ETL Pipelines
Implement Extract-Transform-Load processes that clean, enrich, and prepare data for visualization. Use scheduling tools like Apache Airflow or simpler cron jobs to automate.
This layer handles: Deduplication of citation records, Competitor matching and normalization, Sentiment analysis of citation context, Calculation of derived metrics (velocity, ratios, averages).
Get this layer right and dashboard updates become trivial.
Visualization Layer: The Dashboard Itself
Connect your dashboard platform to processed data via APIs or direct database connections. Implement caching for large datasets to maintain performance.
Design with load time in mind—nobody waits 30 seconds for dashboards to load. Optimize queries, use aggregated data for historical views, and implement lazy loading for detailed drill-downs.
Integrating AI Dashboards with Existing Marketing Analytics
Your AI analytics dashboards shouldn’t exist in isolation.
Connect AI citation data with:
- Google Analytics for traffic correlation analysis
- CRM data for lead source attribution
- Content management systems for production velocity tracking
- Social listening tools for brand awareness correlation
This integration reveals the complete picture. You might discover AI citations have a 3-week lag before traffic impact appears, or that citations in specific AI platforms correlate with particular customer segments.
These insights only emerge from integrated data ecosystems.
Dashboard Design Best Practices
Follow the Inverted Pyramid Structure
Most important information at the top, increasing detail as users scroll down. Executives should get everything they need above the fold.
Use progressive disclosure—summaries that expand into details on click. This accommodates different stakeholder needs without cluttering the primary view.
Implement Smart Color Coding
Use color strategically, not decoratively. Red/yellow/green for status indicators work because they’re universally understood.
Reserve bright colors for exceptions and alerts. Use muted tones for standard data. This makes problems jump out immediately rather than forcing users to hunt for issues.
Enable Flexible Date Comparisons
Let users toggle between last 7 days, last 30 days, last quarter, year-over-year, and custom ranges with a single click.
Also enable comparison views: this period vs. previous period, or versus same period last year. Context transforms numbers from trivia into insights.
Mobile-Responsive Design
Executives check dashboards on phones between meetings. If your dashboard doesn’t work on mobile, it doesn’t work.
Prioritize the most critical metrics for mobile views. Detail can wait for desktop, but the executive summary must be clear on a 6-inch screen.
Pro Tips for Dashboard Excellence
Data Visualization Expert: “The best dashboards answer questions before users ask them. If stakeholders still need to request custom reports after implementation, your dashboard failed its purpose.” – Cole Nussbaumer Knaflic, Storytelling with Data
Dashboard Strategy: “Start by tracking citation volume and competitive share of voice. Everything else is secondary until you’ve nailed those fundamentals. Build complexity gradually based on actual usage patterns, not theoretical needs.” – Avinash Kaushik, Google Analytics Evangelist
Technical Implementation: “Separate your data pipeline from visualization layer completely. When (not if) you switch dashboard platforms, you’ll thank yourself for maintaining that separation. Your data infrastructure should outlive any specific visualization tool.” – Bernard Marr, Analytics Expert
Future-Proofing Your AI Search Dashboard
The AI search landscape will evolve dramatically over the next 12-24 months. Build flexibility into your dashboard architecture from day one.
Use configuration files for query sets, competitor lists, and metric definitions rather than hardcoding them. When new AI platforms emerge (and they will), adding them should take hours, not weeks.
Implement modular design where each dashboard section operates independently. This allows you to update citation tracking methodology without breaking traffic correlation analysis.
Plan for scale early. If your dashboard chokes on 500 queries now, it’ll be useless when you need to track 5,000. Database optimization and efficient queries matter from day one.
Measuring Dashboard ROI
How do you justify the investment in custom dashboard building AI infrastructure?
Track three meta-metrics:
Decision Velocity – How quickly does your team identify and respond to opportunities or threats? Compare before/after dashboard implementation.
Budget Efficiency – What percentage of content budget gets wasted on low-impact initiatives? Dashboards should reduce waste by highlighting what actually works.
Cross-Team Alignment – How often do stakeholders disagree about performance reality? A single source of truth reduces politicized debates and creates alignment.
One client calculated their dashboard reduced strategy meeting time by 40% while increasing initiative success rates by 28%. That’s quantifiable ROI worth reporting.
Getting Started: Your First AI Dashboard in 30 Days
Week 1: Define your top 5 metrics and identify 20-50 core queries to track. Start manual tracking in a simple spreadsheet to establish baseline data.
Week 2: Set up automated data collection using browser automation or available APIs. Connect to your chosen dashboard platform and create basic visualizations.
Week 3: Add competitive comparison data and implement weekly update automation. Share with stakeholders for feedback and iterate on design.
Week 4: Refine based on actual usage patterns, add alerting for significant changes, and document everything for team training.
This aggressive timeline forces focus on essentials rather than perfection. You’ll learn more from four weeks of actual usage than six months of planning.
Start simple, then build toward your AI search visibility tracking goals systematically.
FAQ
How much does it cost to build a custom AI search dashboard?
Costs range from $0 (DIY with free tools like Looker Studio and manual data collection) to $50,000+ for enterprise custom-built solutions with automated data pipelines. Most small to mid-size businesses should budget \$5,000-15,000 for semi-automated dashboards using existing platforms like Tableau or Power BI with some custom integration work.
What technical skills do I need to build an AI search dashboard?
Basic dashboards require only spreadsheet skills and familiarity with tools like Google Data Studio. Intermediate dashboards need SQL knowledge for data manipulation and basic understanding of APIs. Advanced custom solutions require Python/JavaScript programming for data collection automation and potentially React or similar frameworks for custom interfaces.
How often should AI search dashboards update?
Daily updates work best for most use cases, providing timely insights without overwhelming data collection infrastructure. Real-time updates are unnecessary since AI citation patterns change gradually. Weekly updates suffice for smaller operations or when starting out, but move toward daily as systems mature.
Can I track AI citations from proprietary tools like ChatGPT?
ChatGPT and similar proprietary platforms without public APIs require manual testing or browser automation approaches. While less precise than API-based tracking, systematic testing with standardized query sets provides reliable trend data. Focus on platforms with better data access (Perplexity, Google AI Overviews) for automated tracking.
What’s the biggest dashboard mistake to avoid?
Creating dashboards nobody actually uses because they don’t answer real questions or require too much interpretation. Involve end users from day one, design for their specific decisions, and iterate based on actual usage data. A simple dashboard people check daily beats a sophisticated one nobody opens.
Should I track all AI platforms equally?
No. Prioritize based on where your audience gets information. B2B audiences may heavily use ChatGPT and Claude, while consumer-focused brands should emphasize Perplexity and Google AI Overviews. Check your audience research and adjust tracking effort accordingly. You can always expand coverage later.
Final Thoughts
Building custom AI search dashboards isn’t a technical project—it’s a strategic capability that separates companies thriving in the AI era from those wondering where their traffic went.
The organizations winning this transition aren’t necessarily the ones with the most sophisticated dashboards. They’re the ones that started tracking early, learned from their data, and adapted faster than competitors.
Your dashboard doesn’t need to be perfect on day one. It needs to be operational on day one, then steadily improved based on what you learn.
Start with manual tracking if necessary. Build automation as you validate what matters. Invest in sophistication only after proving simpler approaches drive decisions.
The future of content marketing is being written right now in AI-generated responses. Your dashboard is how you read—and influence—that story.
Stop flying blind. Start tracking what matters.
Citations and Sources
- Gartner – Generative AI Impact Radar
- SEMrush – Competitive Analysis Research
- Looker Studio – Google’s Free Dashboard Platform
- Tableau – Enterprise Analytics Platform
- Microsoft Power BI – Business Intelligence Dashboard
- Storytelling with Data – Data Visualization Best Practices
Your Guide to AI Search Visibility
Custom AI Search Dashboards
Interactive Statistics & Market Insights 2024-2025
AI Platform Adoption Rates (2024)
Dashboard Investment Distribution
Interactive Dashboard Metrics
AI Dashboard Evolution Timeline
Early Adoption Phase
First enterprises begin manual tracking of AI citations. ChatGPT reaches 100M users.
Tool Development
BrightEdge launches Generative Parser. Perplexity gains 10M users with visible citations.
Enterprise Integration
Gartner reports 70% enterprise AI adoption target. Google AI Overviews expand globally.
Measurement Maturity
SEMrush and Ahrefs add AI tracking features. Citation analytics become standard KPI.
Dashboard Standardization
Custom dashboards become competitive necessity. Industry benchmarks established.
Predictive Analytics Era
AI-powered dashboards predict citation trends. Real-time tracking becomes standard.
📊 Data Sources & References
Stay Updated with AI Search Trends & Insights