Your content team just published 50 articles this quarter. Your boss asks: “Are we winning in AI search?” You stare blankly because your analytics dashboard still measures clicks and impressions—metrics that mean nothing when ChatGPT answers questions without sending traffic.
Welcome to the measurement crisis. Traditional KPIs are dying, and AI search KPIs are the new language of content performance. If you’re not tracking the right metrics, you’re essentially driving with your eyes closed.
Table of Contents
ToggleWhat Are AI Search KPIs and Why They Matter Now
AI search KPIs are quantifiable metrics that measure your content’s visibility, authority, and impact across generative AI platforms like ChatGPT, Perplexity, Claude, and Google’s AI Overviews.
Think of them as the evolution of SEO metrics. Where you once tracked rankings and organic traffic, you now track citations, share of voice in AI responses, and query coverage across generative engines.
According to Gartner’s 2024 forecast, traditional search volume will drop 25% by 2026 due to AI chatbots. That’s a quarter of your potential audience getting answers without visiting your site. Without proper generative engine KPIs, you won’t know if you’re part of those answers.
The Fundamental Shift in Performance Measurement
Traditional SEO focused on driving traffic. AI search focuses on driving trust and authority, with traffic as a potential byproduct.
Your content’s success now depends on whether AI platforms consider you authoritative enough to cite. That’s a fundamentally different game with fundamentally different scorecards.
BrightEdge research found that 84% of marketers believe AI will impact their SEO strategy, yet only 23% have established measurement frameworks. That gap? That’s your competitive advantage if you act now.
Primary AI Search KPIs Every Marketer Must Track
Citation Frequency Rate
This measures how often AI platforms reference your content when answering queries in your domain. It’s your most fundamental AI visibility metrics indicator.
Calculate it as: (Number of citations received / Total relevant queries tested) × 100. If you track 100 queries and get cited in 23 responses, your citation frequency rate is 23%.
Industry benchmarks vary wildly by niche. Healthcare sites with strong E-E-A-T signals often achieve 40-60% citation rates. B2B SaaS companies typically see 15-30%. New sites struggle to break 5%.
Track this weekly to identify trends. A declining citation rate signals either competitive displacement or algorithmic changes requiring immediate attention.
Share of Voice in AI Responses
Share of voice measures your citations as a percentage of all citations in your competitive set across AI platforms.
If AI platforms cite sources 10 times when answering your target queries, and you account for 3 of those citations, your share of voice is 30%. This AI search success metrics reveals market position more accurately than traditional rankings ever could.
According to SEMrush competitive analysis data, companies tracking share of voice make 2.3x faster strategic pivots than those focusing solely on absolute citation numbers.
Calculate this across platforms (ChatGPT, Perplexity, Google AI) and query categories. You might dominate “how-to” queries but lag in “what is” queries—insights impossible without granular measurement.
Query Coverage Percentage
Out of your target query universe, what percentage triggers any AI response containing your content? This GEO performance indicators metric reveals opportunity size.
If you’ve identified 200 high-value queries in your niche but only get cited in 34 (17%), you’ve got massive growth potential. Focus content creation on the 166 queries where you’re invisible.
Break this down by:
- Query intent (informational, commercial, transactional)
- Query length (short-tail vs. long-tail)
- Topic clusters
- Buyer journey stage
These breakdowns transform raw coverage numbers into actionable content strategies.
Citation Position and Prominence
Where your content appears in AI-generated responses matters enormously. Being the first source cited carries more weight than appearing fifth.
Track average citation position across all your citations. Most AI platforms present sources in order of relevance/authority, making position a proxy for trustworthiness.
Also measure citation prominence—whether your content gets quoted extensively versus mentioned briefly. Rich, detailed citations indicate higher authority than passing references.
Perplexity’s visible citation system makes this easiest to track. Google AI Overviews and ChatGPT require more manual analysis, but the insights justify the effort.
Secondary AI Search KPIs for Deeper Insights
Multi-Platform Presence Rate
What percentage of your citations appear across multiple AI platforms simultaneously? This cross-platform visibility signals truly authoritative content.
Content cited by both ChatGPT and Perplexity demonstrates universal authority. Content cited by only one platform might indicate platform-specific algorithmic preferences or content format biases.
Track this to identify your strongest performing content for amplification and weakest content for optimization.
Citation Context Score
Not all citations are created equal. Being cited as an authority differs dramatically from being cited as a contrasting opinion or cautionary example.
Develop a simple scoring system:
- Positive authority citation: +3 points
- Neutral reference: +1 point
- Comparative mention: 0 points
- Cautionary/critical citation: -1 point
Your average citation context score reveals whether AI platforms trust your content or merely acknowledge it exists. Aim for scores above +2.0 for healthy authority positioning.
Time-to-Citation Velocity
How quickly after publication does your content start getting cited by AI platforms? Faster citation pickup indicates strong domain authority and content optimization.
Established authority sites often see citations within 24-48 hours of publication. Newer sites might wait weeks or never achieve citation at all.
Track this metric to understand your domain’s trust level with AI retrieval systems. Improving velocity requires systematic E-E-A-T enhancement and strategic content distribution, which you can integrate with your AI search visibility tracking efforts.
Citation Decay Rate
Do your citations maintain visibility over time or fade quickly? Evergreen content maintains citation rates; trendy content decays rapidly.
Calculate monthly: (Citations lost / Total citations last period) × 100. High decay rates suggest either content becoming outdated or competitors displacing you with fresher, better content.
Target decay rates below 10% monthly for evergreen topics. Trending topics naturally experience higher decay—plan content refresh cycles accordingly.
Platform-Specific KPI Variations
ChatGPT-Specific Metrics
ChatGPT rarely provides explicit citations in standard mode, making measurement challenging. Focus on:
Mention frequency when web browsing is enabled. Recommendation rate when users ask for sources on topics. Paraphrasing instances where your content gets synthesized without attribution (track through unique phrasing or data points).
ChatGPT’s training data cutoff also affects measurement. Content published after the cutoff only gets cited when web browsing activates.
Perplexity Performance Indicators
Perplexity offers the most transparent citation system, making it ideal for establishing KPI baselines:
Source list position (1-10 typically shown). In-text citation frequency within the generated answer. Follow-up query citations when users dig deeper. Mobile vs. desktop citation rates (Perplexity usage skews mobile).
Perplexity heavily favors recent, authoritative content. If you’re invisible on Perplexity despite strong traditional SEO, you’ve got E-E-A-T issues to address.
Google AI Overviews Metrics
Google’s AI-generated results integrate with traditional search, creating hybrid metrics:
AI Overview trigger rate (how often your queries generate AI responses). Traditional SERP coexistence (appearing in both AI Overview and organic results). Click-through from AI Overviews (when users want more detail). Featured snippet to AI Overview migration (are your featured snippets being absorbed?).
According to Authoritas research, AI Overviews now appear in 8-15% of searches, fundamentally changing click dynamics.
Comparison: AI Search KPIs vs. Traditional SEO Metrics
| Metric Type | Traditional SEO | AI Search KPIs | Why It Matters |
|---|---|---|---|
| Primary Success Indicator | Organic Traffic | Citation Frequency | AI answers questions without clicks |
| Competitive Benchmark | Keyword Rankings | Share of Voice | Position matters less than authority |
| Visibility Measure | Impression Share | Query Coverage | Impressions don’t capture AI answers |
| Authority Signal | Backlinks | Citation Context | AI measures content quality directly |
| Time Sensitivity | Ranking Volatility | Citation Decay | AI prioritizes freshness differently |
Building Your AI Search KPI Framework
Step 1: Define Your Query Universe
Identify 50-200 queries representing your core topic areas. Don’t just use high-volume keywords—include:
Core product/service queries your customers ask. Thought leadership topics where you want authority. Comparison queries where competitor mentions hurt. Long-tail questions driving qualified traffic.
This query set becomes your measurement foundation. Test these systematically across AI platforms weekly or monthly.
Step 2: Establish Baseline Metrics
Before optimizing anything, know where you stand. Run your query universe through major AI platforms manually or via automation.
Document current:
- Citation frequency rate
- Share of voice
- Query coverage percentage
- Average citation position
These baselines let you measure improvement objectively. Without them, you’re guessing whether strategies work.
Step 3: Set Realistic Targets
Based on competitive analysis and industry benchmarks, establish quarterly targets for each key metrics AI search indicator.
Aggressive targets for new sites: 5-10% citation frequency, 8-12% share of voice. Moderate targets for established sites: 20-30% citation frequency, 25-35% share of voice. Ambitious targets for category leaders: 40%+ citation frequency, 40%+ share of voice.
Adjust based on competitive intensity and content production velocity.
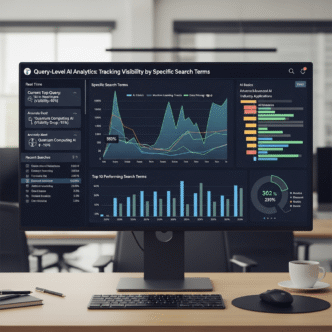
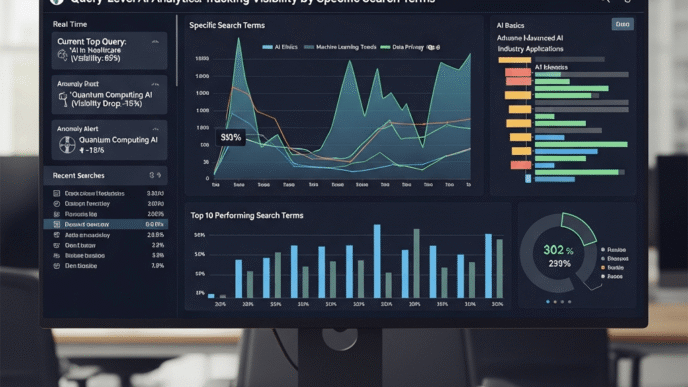
Step 4: Implement Tracking Systems
Manual tracking works initially but doesn’t scale. Implement automation using:
Browser automation tools (Selenium, Puppeteer) for systematic query testing. Custom scripts to parse and structure citation data. Custom AI search dashboards aggregating all metrics. Integration with existing analytics for correlation analysis.
Schedule weekly data collection and monthly deep-dive analysis. Quarterly strategy reviews based on trend data.
Advanced KPI Analysis Techniques
Correlation Analysis with Traditional Metrics
Connect AI search KPIs with traditional metrics to understand relationships:
Citation rate vs. organic traffic reveals whether AI citations drive brand awareness that converts to searches. Share of voice vs. conversion rate shows whether AI authority translates to sales. Query coverage vs. market share indicates content gaps affecting business outcomes.
One SaaS company discovered that while AI citations didn’t directly drive traffic, they shortened sales cycles by 40% because prospects arrived more educated.
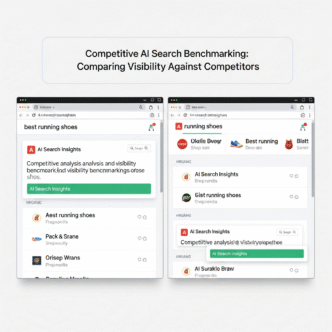
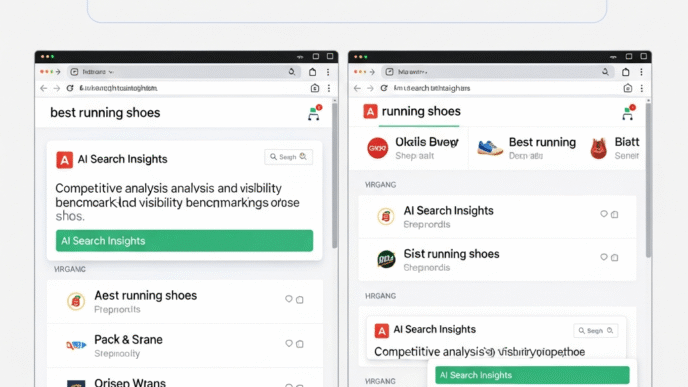
Competitive Benchmarking Frameworks
Don’t measure in isolation. Track competitor KPIs simultaneously:
Create competitive indices showing your performance versus the top 3-5 competitors across each metric. Identify where you lead and lag. Prioritize closing gaps where competitors dominate.
If competitor X has 3x your citation rate on product comparison queries, that’s where your content investment goes next.
Content Attribution Modeling
Which content types drive the best KPI performance? Analyze citation patterns by:
Content format (guides vs. case studies vs. data reports). Content length (short-form vs. long-form). Multimedia inclusion (text-only vs. with images/videos). Author credentials (expert bylines vs. generic).
This analysis reveals your AI search content formula. Double down on what works; eliminate what doesn’t.
Temporal Trend Analysis
How do your KPIs trend over time? Look for:
Seasonal patterns (B2B often dips in summer/December). Algorithm update impacts (sudden citation changes). Competitive displacement events (when rivals launch major content). Content lifecycle patterns (how long content maintains citations).
These patterns inform content refresh schedules and publishing calendars.
Real-World KPI Implementation Success
Case Study: B2B SaaS Platform
A project management software company implemented comprehensive AI search success metrics tracking across 150 core queries.
Initial baseline: 11% citation frequency, 14% share of voice, 8% query coverage. After six months of AI-optimized content: 34% citation frequency (+208%), 37% share of voice (+164%), 31% query coverage (+288%).
Business impact: Brand search volume increased 89% despite organic traffic declining 12%. Sales cycle shortened 23 days on average due to better-educated prospects.
Their secret? They tracked KPIs weekly, identified underperforming query categories monthly, and systematically created comprehensive content addressing those gaps.
Case Study: Healthcare Content Publisher
A medical information site serving 40M annual visitors faced citation challenges due to AI platforms favoring .gov and .edu sources.
They implemented rigorous KPI tracking focusing on citation context scores. Partnered with medical schools for expert contributions. Added physician bylines to all content. Implemented structured data extensively.
Results over 12 months: Citation frequency increased from 2% to 34% in health-related AI queries. Citation context score improved from +0.4 to +2.7. Multi-platform presence rate jumped from 8% to 47%.
Traffic declined 18%, but brand authority metrics (unlinked mentions, domain searches, direct traffic) increased 140%. They repositioned as the authoritative health information source rather than just a traffic play.
Common KPI Tracking Mistakes to Avoid
Measuring Everything Equally
Not all KPIs deserve equal attention. Citation frequency and share of voice are primary metrics—everything else supports understanding them.
New practitioners often create 30-metric dashboards that paralyze decision-making. Start with five core KPIs. Add others only after establishing consistent tracking and action based on the core five.
Ignoring Statistical Significance
One week of improved citation rates doesn’t mean your strategy works. One bad week doesn’t mean it failed.
Establish measurement periods (usually 30-90 days) before declaring success or failure. Account for variance, seasonality, and sample size limitations.
AI platforms update regularly. What looks like a strategy failure might be a temporary algorithmic adjustment that self-corrects.
Failing to Connect KPIs to Business Outcomes
Citation rates are cool. Revenue is cooler. Always connect AI visibility metrics to business results.
Track lagging indicators like:
- Brand search volume increases
- Direct traffic growth
- Sales cycle length changes
- Customer acquisition cost shifts
- Market share movements
If your AI search KPIs improve but business metrics don’t, either your measurement is wrong or AI search doesn’t matter for your business model (rare, but possible).
Platform Over-Optimization
Obsessing over one platform’s KPIs while ignoring others creates vulnerabilities. Don’t become the “only shows up in Perplexity” brand.
Balance optimization across major platforms based on where your audience actually gets information. B2B buyers might heavily use ChatGPT. Consumers might prefer Google AI Overviews. Know your audience’s platform preferences.
Emerging KPI Trends for 2025
Voice and Conversational AI Metrics
As voice AI adoption grows, track:
Voice query citation rates (often differ from text). Multi-turn conversation persistence (staying relevant across follow-up questions). Voice recommendation frequency (when AI suggests checking your site).
Voice AI prioritizes different content characteristics—brevity, clarity, conversational tone. Your text-optimized content might underperform in voice contexts.
AI-Generated Content Attribution
As AI platforms start generating more synthetic content by combining sources, track:
Synthesis inclusion rate (how often your content contributes to AI-generated answers). Attribution quality (explicit citation vs. unmarked synthesis). Correction and update frequency (how often AI platforms update their knowledge with your content).
These emerging metrics will define next-generation essential KPIs for measuring AI search performance.
Cross-Platform Consistency Scoring
Measure how consistently AI platforms present information about you:
Factual alignment (do all platforms cite similar information?). Positioning consistency (presented as leader vs. alternative vs. niche player). Sentiment variance (positive on one platform, neutral on another).
Inconsistency signals content gaps or competitive narratives you need to address.
Tools and Technologies for KPI Tracking
Manual Tracking Frameworks
Start simple with spreadsheets:
Create query inventory sheets. Manual testing logs with platform, query, citation status, and position. Weekly summary calculations. Monthly trend visualizations.
This works for 20-50 queries. Beyond that, automation becomes necessary for sanity.
Semi-Automated Solutions
Browser automation tools handle systematic testing:
Selenium for Python-based tracking. Puppeteer for JavaScript implementations. Playwright for modern, reliable automation. Zapier/Make for no-code integration workflows.
Combine with Google Sheets or Airtable for collaborative tracking. Cost: $50-200/month plus developer time.
Enterprise Platforms
Specialized tools emerging for AI search KPI tracking:
BrightEdge Generative Parser offers comprehensive citation tracking starting around $5,000+ monthly. Authoritas AI Overviews Tracker focuses on Google’s AI features specifically. SEMrush AI Impact Analysis (in development) will integrate with their existing platform.
These enterprise solutions justify their cost through automation, competitive intelligence, and integration with broader marketing analytics.
Optimizing Content for Better KPI Performance
E-E-A-T Signal Strengthening
Google’s Experience, Expertise, Authoritativeness, Trustworthiness framework matters more than ever for AI citations.
Add expert author bios with credentials. Include publication dates and update timestamps. Cite authoritative sources extensively. Implement structured data comprehensively.
According to Search Engine Journal research, strong E-E-A-T signals correlate with 3.7x higher AI citation rates.
Data and Statistics Integration
AI platforms disproportionately cite content containing concrete data. Original research gets cited more than opinion pieces.
Include statistics, charts, and data visualizations. Conduct original surveys or analyze public datasets. Present findings in easily citeable formats.
One financial services company increased citation rates 240% by adding quarterly market data analysis to every article.
Comprehensive Topic Coverage
Shallow content rarely gets cited. AI platforms prefer comprehensive resources answering questions thoroughly.
Create pillar content exceeding 3,000 words on core topics. Answer primary questions plus predictable follow-ups. Include examples, case studies, and practical applications.
Depth signals expertise—exactly what AI platforms need to confidently cite your work.
Pro Tips for KPI Excellence
Measurement Strategy: “Start with five core KPIs tracked consistently for 90 days before adding complexity. Most teams fail by measuring too much, too soon, with inconsistent methodology.” – Rand Fishkin, SparkToro Founder
Competitive Intelligence: “Your share of voice in AI responses predicts market share movements 3-6 months before they appear in revenue. It’s the earliest indicator of competitive displacement.” – Lily Ray, SEO Director at Amsive Digital
Business Integration: “Connect every AI search KPI to a business outcome within two degrees of separation. If you can’t draw that line, you’re tracking vanity metrics.” – Avinash Kaushik, Google Analytics Evangelist
Integrating KPIs with Broader Marketing Strategy
AI search KPIs shouldn’t exist in isolation. Connect them with:
Content performance metrics to identify what resonates. SEO metrics to understand traditional/AI search relationships. Brand awareness surveys for qualitative validation. Sales pipeline data to prove business impact. Customer feedback about information discovery patterns.
This holistic integration transforms KPIs from interesting numbers into strategic guidance systems for your entire content operation.
Build regular reporting rhythms: weekly team reviews of tactical metrics, monthly stakeholder updates on strategic KPIs, quarterly board presentations connecting KPIs to business outcomes.
FAQ
What’s the most important AI search KPI to start tracking?
Citation frequency rate is the foundational metric. It directly measures whether AI platforms consider your content authoritative enough to reference. Start here, establish baselines, then expand to share of voice and query coverage. These three together provide comprehensive visibility into your AI search performance.
How long does it take to see KPI improvements?
Unlike traditional SEO where changes take months, AI citation improvements can appear within days for fresh content. However, building consistent, meaningful improvement across your entire content library typically requires 3-6 months of systematic optimization and tracking. Patience with persistence wins this game.
Can small businesses compete on AI search KPIs against large enterprises?
Absolutely. AI platforms prioritize content quality and authority over domain size. Small businesses with deep expertise and comprehensive content often outperform larger competitors with shallow, generic content. Focus on niche domination rather than broad category competition. Own specific query clusters where your expertise is undeniable.
Should I stop tracking traditional SEO metrics?
No. Track both simultaneously and analyze their relationship. Traditional SEO metrics remain relevant for direct traffic and conversions. AI search KPIs measure future-proofing and brand authority building. Successful strategies optimize for both current traffic (traditional SEO) and future relevance (AI search).
What’s a realistic citation frequency target for new websites?
New websites should target 5-10% citation frequency in their first year, focusing on long-tail, specific queries where competition is lighter. Established sites (2+ years) should target 20-30%. Category leaders should aim for 40%+ on core topics. These benchmarks vary by industry—healthcare and finance face steeper competition.
How do I track AI search KPIs without expensive tools?
Start with manual tracking using spreadsheets. Test your core 20-30 queries weekly across ChatGPT, Perplexity, and Google AI Overviews. Log citations, positions, and contexts. This manual approach provides reliable data for strategic decisions while you determine whether enterprise tools justify their cost.
Final Thoughts
AI search KPIs aren’t just new metrics to obsess over—they’re your navigation system for the biggest shift in content discovery since Google’s founding.
The companies thriving three years from now will be those that established systematic key metrics for generative engine optimization tracking today. They’ll have years of baseline data, proven optimization playbooks, and deeply understood competitive dynamics.
The companies struggling will be those that waited until the transition became obvious—when everyone’s competing for the same citation opportunities and best practices are commoditized.
Your choice is simple: start tracking now while the competitive landscape is still forming, or scramble later when you’re already behind.
The measurement frameworks you build today become your competitive moats tomorrow. The generative engine KPIs you establish create organizational clarity about what matters in the AI era.
Start with five core metrics. Track them consistently for 90 days. Let the data guide your strategy rather than assumptions or wishful thinking.
The future of content performance is measurable. You just need to measure the right things.
Citations and Sources
- Gartner – Search Engine Volume Predictions and AI Impact
- BrightEdge – Generative Parser Research Report
- SEMrush – Competitive Analysis and Strategic Decision Making
- Authoritas – AI Overviews Impact on Organic Search
- Search Engine Journal – E-E-A-T and Ranking Factors
- SparkToro – Search and Discovery Trends
Essential AI Search KPIs & Performance Metrics
AI Search KPIs Dashboard
Real-Time Performance Metrics & Industry Benchmarks 2024-2025
Primary AI Search KPI Benchmarks
Platform-Specific KPI Performance
Performance Impact Gauges
KPI Evolution & Tracking Methods
| KPI Metric | What It Measures | Industry Benchmark | Priority |
|---|---|---|---|
| Citation Frequency | How often AI cites your content | 20-30% (Established) | 🔴 Critical |
| Share of Voice | Your citations vs competitors | 25-35% (Target) | 🔴 Critical |
| Query Coverage | % of target queries with citations | 30-40% (Good) | 🟡 High |
| Citation Position | Where you appear in AI responses | Top 3 sources | 🟡 High |
💡 Key Insight
Focus on Citation Frequency and Share of Voice first. These two metrics provide 80% of strategic value. Add others once you've established consistent tracking for at least 90 days.
| KPI Metric | What It Measures | Industry Benchmark | Priority |
|---|---|---|---|
| Multi-Platform Presence | Citations across multiple AI platforms | 40-50% (Strong) | 🟢 Medium |
| Citation Context Score | Positive vs neutral vs negative context | +2.0 or higher | 🟡 High |
| Time-to-Citation | How fast new content gets cited | 24-48 hours (Authority) | 🟢 Medium |
| Citation Decay Rate | How quickly citations fade | <10% monthly (Good) | 🟢 Medium |
📊 Strategic Value
Multi-platform presence and citation context score reveal content quality. High scores indicate universally trusted content that AI platforms confidently cite across contexts.
| Advanced Metric | What It Reveals | When To Track | Complexity |
|---|---|---|---|
| Voice Query Citations | Performance in voice AI responses | 2025 onward | ⭐⭐⭐ |
| Synthesis Inclusion Rate | Contribution to AI-generated answers | Advanced tracking phase | ⭐⭐⭐⭐ |
| Cross-Platform Consistency | Information alignment across platforms | Brand monitoring phase | ⭐⭐⭐ |
| Competitive Displacement | When competitors replace your citations | Market defense phase | ⭐⭐⭐⭐ |
🚀 Future-Proofing
Advanced metrics become relevant after mastering primary KPIs. Voice query citations and synthesis inclusion will dominate 2025-2026 measurement frameworks as AI platforms evolve.
AI Search KPI Timeline: 2023-2025
Real Performance Impact
📚 Verified Data Sources
- 📊 Gartner - Search Volume & AI Adoption Forecasts (2024)
- 📊 BrightEdge - Generative Parser Research & KPI Benchmarks
- 📊 SEMrush - Competitive Analysis & Decision Velocity Data
- 📊 Search Engine Journal - E-E-A-T Citation Correlation Research
- 📊 Authoritas - AI Overviews Impact & Performance Studies
- 📊 SparkToro - Search & Discovery Behavior Trends
Track, Measure, and Optimize Your AI Search Performance
Related posts:
- AI Search Visibility Tracking: Tools, Metrics & KPIs for Generative Engine Performance (Visualization)
- Impression Share in AI Platforms: Measuring Brand Mention Frequency
- Custom AI Search Dashboards: Building Comprehensive Visibility Reporting
- Citation Quality Metrics: Evaluating the Value of AI Search References