


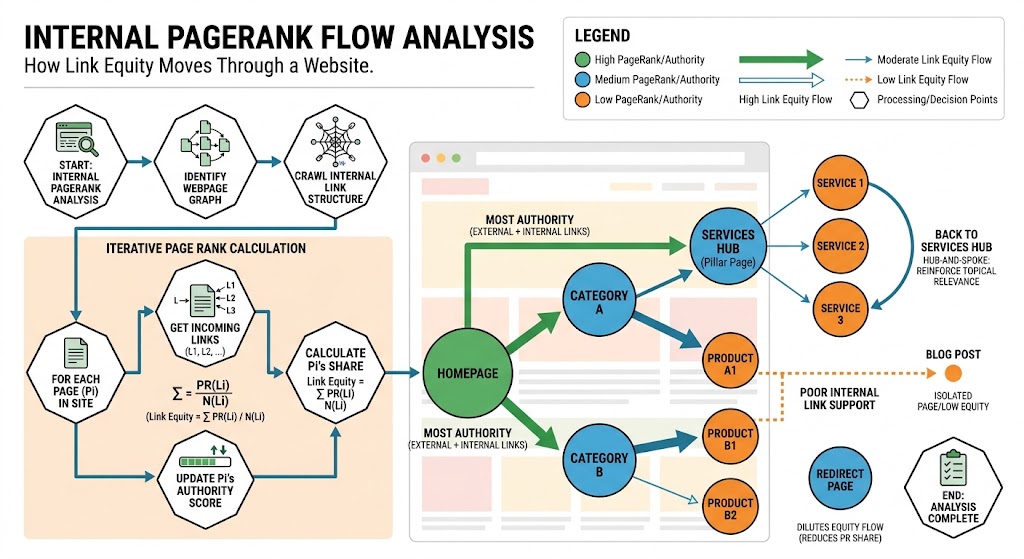
An internal-link audit can count every route on a website and still miss the structural problem. Ten links from weak, isolated pages do not carry the same graph significance as one route from a page that receives links across the site.
Internal PageRank analysis models a website as a directed graph: each indexable page is a node, and each crawlable internal link is an edge pointing towards another node. The calculation estimates how relative importance circulates through that closed graph; it does not reveal Google’s private PageRank values.
This article develops the graph-analysis layer introduced in Internal Linking Strategy: The Hidden Power of On-Page SEO. Its purpose is diagnostic: make the assumptions visible, compare architecture states and identify pages whose internal support conflicts with their intended role.
Post Summary
Internal PageRank compares relative link distribution inside a defined crawl; it is not a Google score.
The model requires a directed graph, a damping value, rules for duplicate links and a method for handling pages with no outgoing edges.
In a basic model, a page divides its available score across its followed outgoing links.
Raw inlink counts miss the importance and outlink load of each source page.
A four-page graph can expose the model’s assumptions better than a 50,000-URL export.
Architecture changes should be compared with the same crawl scope and calculation settings.
Table of Contents
ToggleWhat internal PageRank analysis measures
Internal PageRank analysis measures the relative probability assigned to pages by a link-based model operating on one website graph. A URL gains score from pages that link to it, while each source divides its contribution among its outgoing routes.
Brin and Page’s 1998 paper described PageRank as a recursive calculation in which links from highly ranked pages contribute more than links from lower-ranked pages. The calculation also normalised contribution by the source page’s number of outgoing links (Source: Google Research, 1998).
That foundational idea remains useful for internal architecture analysis, but the boundary must stay visible. Google’s current ranking systems, weighting choices, canonical processing and treatment of individual links are not reproduced by a crawler export and a public formula.
Google’s current documentation supports two narrower claims. Links help Google find pages, and Google uses them as a relevance signal; it also advises that every page considered important should receive a link from at least one other page (Source: Google Search Central, 2025).
An internal model can therefore answer questions about the site you crawled:
Which pages receive a large share of the calculated distribution?
Which priority URLs receive little structural support?
Where do sitewide templates dominate the graph?
Which pages distribute their score across hundreds of destinations?
How does the distribution change after a navigation or contextual-link edit?
It cannot tell you the PageRank Google assigned, the weight Google gave a specific link or the ranking change a proposed edit will produce.
Inlink count and graph score answer different questions
Inlink count asks how many internal links point to a URL. A graph calculation asks where those links originate, how much calculated score each source holds and how many destinations divide that source’s contribution.
Consider two pages with five unique inlinks each. The first receives its routes from isolated archives that each point to 100 URLs; the second receives routes from connected hub pages with ten outgoing destinations. Their counts match, but a basic PageRank model will assign different contributions.
This does not make the second page more relevant to a query. It identifies a structural difference that deserves interpretation beside content purpose, canonical status, search demand and user journeys.
Build an internal link graph that can be reproduced
A useful model begins with a crawl definition, not a formula. Changing the start URLs, rendering mode, canonical rules or included link types changes the graph and makes before-and-after scores incomparable.
Google can normally crawl an internal route when it is an HTML <a> element with an href that resolves to a web address. Scripted elements without that structure may not supply the same dependable discovery path (Source: Google Search Central, 2025).
Define the nodes
Start with indexable, canonical HTML pages unless the analysis has a specific reason to include another class. Redirects, canonical duplicates, noindex URLs, errors and parameter variants can be retained in separate diagnostic exports without becoming equal nodes in the main model.
Document these choices:
| Model decision | Example rule | Why it changes the result |
|---|---|---|
| Crawl scope | Production host only | Staging hosts and subdomains create extra nodes |
| Rendering | JavaScript rendering enabled | Client-rendered links may enter the graph |
| Canonicals | Consolidate to the preferred URL | Duplicate nodes can split calculated support |
| Status codes | Use final 200 HTML destinations | Redirect hops distort routes |
| Duplicate links | One edge per source–destination pair | Template repetition can inflate counts |
| Nofollow | Record separately | Public tools may process it differently |
| Dangling pages | Redistribute their score | Pages with no outlinks otherwise leak probability |
Canonical consolidation needs care. If ten crawled URLs declare one canonical, collapsing them without recording the original edges can hide broken implementation. Keep a raw diagnostic graph, then create a cleaned graph for architecture comparison.
Create directed edges
An edge runs from the source page to the destination. A homepage link to /services/ creates Home → Services; the reverse edge exists only if the services page links back.
Count unique source–destination pairs for a baseline model. Repeated links from one page can be stored as attributes for placement analysis, but treating five links to the same destination as five independent votes can make template repetition dominate the calculation.
Google advises publishers to use descriptive anchors and meaningful surrounding text, yet a basic PageRank formula does not understand those words (Source: Google Search Central, 2025). Graph importance and link context belong in connected but separate checks.
State the calculation
A common teaching implementation uses this form:
PR(i) = (1 - d) / N + d × Σ [PR(j) / L(j)]PR(i) is the score of destination page i; d is the damping factor; N is the number of nodes; j represents each page linking to i; and L(j) is the count of outgoing edges from source j.
NetworkX documents 0.85 as the default damping parameter in its PageRank implementation and uses a uniform distribution when no personalisation vector is supplied (Source: NetworkX, 2026). Use 0.85 as a declared modelling choice, not a claim about Google’s current production setting.
The calculation runs iteratively until the difference between rounds falls below a chosen tolerance. Record the software version, damping value, convergence tolerance, edge rules and crawl date beside every export.
Pro Tip: In Screaming Frog SEO Spider, run Crawl Analysis → Start after the crawl and check the Internal tab’s Link Score column. Treat the 0–100 value as Screaming Frog’s relative metric; a pass means the column is populated for all indexable HTML URLs in the comparison set, while blanks mean the analysis or scope is incomplete.
A four-page worked model
The following example is hypothetical. It exists to expose the mechanics, not to prescribe a website structure.
The graph contains four nodes:
Home links to A, B and C.
A links to B and C.
B links to C.
C links to A.
Using d = 0.85, a uniform starting distribution and one edge per source–destination pair, the model converges to these rounded values:
| Page | Unique inlinks | Unique outlinks | Calculated share |
|---|---|---|---|
| Home | 0 | 3 | 0.0375 |
| A | 2 | 2 | 0.3732 |
| B | 2 | 1 | 0.2068 |
| C | 3 | 1 | 0.3825 |
C receives the highest score because Home, A and B point to it, while B sends its full outgoing contribution to C. A ranks close behind because C sends its full contribution to A.
B has the same inlink count as A but a lower result. Its sources divide their contribution among several destinations, while one of A’s sources points only to A.
Home receives only the base probability because no page in this closed graph links back to it. Real homepages gain external links and persistent internal routes, but this model contains neither. The unexpectedly low value is evidence about the dataset boundary, not evidence that the homepage lacks search importance.
Interactive visual guide
Internal PageRank Analysis Workflow
Follow a crawl from raw internal links to a documented architecture decision.
PR(i) = (1 − d) / N + d × Σ[PR(j) / L(j)]
d = declared damping choice · N = included nodes · scores are relative
What the example proves
The table proves how this declared formula behaves on this declared graph. It does not prove that C would rank above A or B.
The example also exposes a frequent modelling error: treating the crawl as a complete account of authority. An internal-only graph excludes external links, unobserved URLs, Google’s canonical choices and any link weighting outside the public calculation.
Run a tiny graph like this before analysing the full site. If the output cannot be explained edge by edge, adding thousands of URLs produces a larger mystery rather than a better audit.
Read distributions without turning them into ranking forecasts
The safest use of internal PageRank is comparative. Hold the crawl and calculation settings constant, change the proposed architecture, then measure which page groups gain or lose relative share.
Compare page roles, not unrelated URLs
Group pages by their intended job: pillar, cluster, product, category, article, utility, archive or policy. A policy page and a revenue-driving category page do not require matching scores.
Calculate distribution by group as well as by URL. If 40% of modelled score flows into tag archives that the editorial plan treats as secondary, the mismatch is easier to see at group level than in a long URL table.
That percentage would describe your model output, not a Google metric. Label charts with the crawl date, node filters and calculation version so the number cannot be detached from its method.
Investigate outliers before editing
A high score can be intentional: the page sits in main navigation and supports a primary user task. It can also result from a template accident, a calendar loop or thousands of faceted pages pointing towards one endpoint.
A low result deserves the same restraint. The URL could be newly published, intentionally deep, linked through JavaScript that the crawl did not render or consolidated under another canonical.
Check each outlier against four facts:
Is the page indexable and canonical?
Does its intended role justify stronger or weaker internal support?
Are its incoming routes crawlable in rendered HTML?
Would a new link answer a real next question for the reader?
Only the fourth check authorises an editorial link. Moving calculated score without serving a reader turns the model into architecture theatre.
Compare architecture states
Save a baseline export before changing menus, hub pages or contextual routes. Re-crawl with the same settings after implementation and compare URL-level and page-group distributions.
Use change bands for triage rather than universal pass marks. For example, flag the largest 5% of gains and losses inside the model, then inspect their causes. The 5% is an audit queue chosen by the analyst; it is not a ranking threshold.
Google’s SEO Starter Guide says changes can take from hours to several months to appear in Search and advises waiting a few weeks before assessing effects (Source: Google Search Central, 2025). Graph recalculation shows the implemented architecture immediately, while search performance requires a separate observation window.
Tool scores and model limits
Crawler metrics are useful when their definitions are treated as part of the data. Screaming Frog describes Link Score as a 0–100 relative value based on internal links and similar to PageRank; the column requires crawl analysis (Source: Screaming Frog, 2026).
NetworkX returns PageRank values based on the supplied graph, damping parameter, personalisation vector, edge weights and dangling-node treatment (Source: NetworkX, 2026). Two tools can therefore produce different outputs without either calculation being defective.
Five variables that change the result
Crawl coverage: blocked, orphaned or undiscovered pages never become nodes.
Rendering: JavaScript-only routes enter one crawl configuration and disappear from another.
Canonical handling: duplicates can remain separate or merge into a preferred URL.
Template links: navigation and footer edges can dominate the graph unless analysed by placement.
Personalisation: the starting or teleport distribution can be uniform or biased towards selected pages.
The original PageRank paper used a random-surfer interpretation and described 0.85 as its usual damping value at the time (Source: Google Research, 1998). That historical model remains instructive; it is not a specification for Google Search in 2026.
Weighted models add judgement, not certainty
An analyst can assign different weights to navigation, breadcrumb and contextual links. The output then answers a new question based on those chosen weights.
Run the unweighted model first. Add a weighted version only when the weighting rule is documented and tied to a clear hypothesis, then present both outputs. A single customised score hides how much of the result came from the site and how much came from the analyst.
AI search does not create a public internal-PageRank metric
Google states that AI Overviews and AI Mode use the same foundational SEO requirements as Search and do not require special markup or separate optimisation (Source: Google Search Central, 2025). Its documentation does not publish an internal PageRank score for AI features.
Internal architecture still supports discovery and comprehension because a supporting page must be indexed and eligible for Search before it can appear as a supporting link. Do not rename a conventional graph score as “AI authority”; the label adds certainty that the evidence does not supply.
Questions about internal PageRank
Is internal PageRank still relevant to SEO?
Yes, as an architecture-analysis method. It shows how a declared algorithm distributes relative score across a crawled internal-link graph, but it does not expose Google’s current PageRank values.
Does every internal link pass equal value?
Equal division is an assumption in a basic unweighted model. Google does not publish the current production weight assigned to every internal link, so tool scores should not be presented as measurements of that system.
Should navigation links be included?
Include them in the baseline because they are real crawlable routes. Segment template and contextual links afterwards so sitewide navigation does not hide editorial relationships.
Does nofollow change the calculation?
It changes the graph only if the analyst’s rules exclude or reweight those edges. Record the choice, preserve a raw export and avoid claiming that the model matches Google’s current handling.
Can internal PageRank predict ranking gains?
No. Rankings depend on relevance, quality, external signals, query context and systems that the internal model does not contain. Use the calculation to find structural questions, then validate each change through crawl evidence and search-performance data.
Put the model to work
Begin with one reproducible crawl and one unweighted graph. Record the node rules, unique-edge treatment, damping value, dangling-page method, software version and crawl date before interpreting a score.
Compare page roles, inspect outliers and model proposed edits before publishing them. A new route should improve the reader’s path as well as the calculated distribution.
Return to the internal linking strategy pillar when the graph exposes an architecture problem involving hierarchy, anchors, orphan pages or maintenance. The next action is concrete: calculate a baseline, select five unexplained outliers and trace every contributing edge before changing the site.
References
Brin, Sergey and Page, Lawrence. The Anatomy of a Large-Scale Hypertextual Web Search Engine. Google Research/Computer Networks, 1998. https://research.google/pubs/the-anatomy-of-a-large-scale-hypertextual-web-search-engine/
Google Search Central. Link Best Practices for Google. Updated 10 December 2025. https://developers.google.com/search/docs/crawling-indexing/links-crawlable
Google Search Central. Search Engine Optimization (SEO) Starter Guide. Accessed 8 September 2026. https://developers.google.com/search/docs/fundamentals/seo-starter-guide
NetworkX. pagerank — NetworkX 3.6.1 Documentation. Accessed 8 September 2026. https://networkx.org/documentation/stable/reference/algorithms/generated/networkx.algorithms.link_analysis.pagerank_alg.pagerank.html
Screaming Frog. SEO Spider Tabs: Internal and Links. Accessed 8 September 2026. https://www.screamingfrog.co.uk/seo-spider/user-guide/tabs/
Google Search Central. AI Features and Your Website. Updated 10 December 2025. https://developers.google.com/search/docs/appearance/ai-features