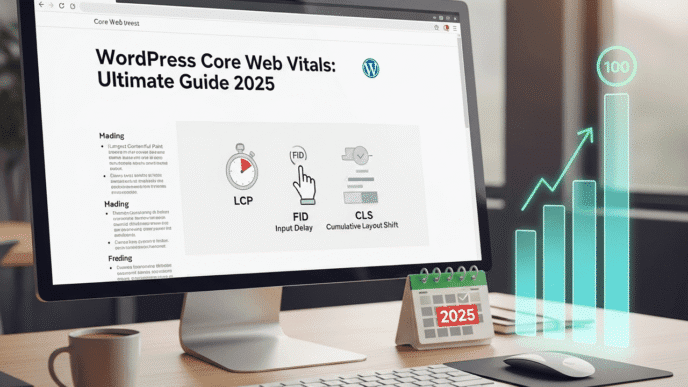


Core Web Vitals come down to three questions about every page: does the main content show up quickly (LCP), does the page respond quickly when someone taps or clicks (INP), and does the layout stay still while it loads (CLS)? This guide takes each metric in turn: what it measures, how to find what is slowing it down, and the fixes that move it.
For the bigger picture (why speed matters, lab vs field data, budgets and the business case) start with our Site Speed & Core Web Vitals guide. This page is the hands-on companion.
Table of Contents
ToggleThe Three Targets
| Metric | What it measures | Good | Needs improvement | Poor |
|---|---|---|---|---|
| LCP — Largest Contentful Paint | How long until the largest image or text block in view is rendered | ≤ 2.5 s | 2.5–4 s | > 4 s |
| INP — Interaction to Next Paint | How long the page takes to show a visual response after a click, tap or key press | ≤ 200 ms | 200–500 ms | > 500 ms |
| CLS — Cumulative Layout Shift | How much visible content moves unexpectedly | ≤ 0.1 | 0.1–0.25 | > 0.25 |
A page passes when 75% of real visits meet the “good” target, measured separately on mobile and desktop. Check your real-user numbers in Search Console’s Core Web Vitals report or the top section of PageSpeed Insights before you start fixing anything.
What happened to FID? First Input Delay only measured the delay before the first interaction was handled. On 12 March 2024, Google replaced it with INP, which looks at almost every interaction during the visit and includes the time to update the screen. If an older guide or plugin still reports FID, use INP instead.
Part 1 — LCP: Make the Main Content Appear Fast
Find your LCP element first
Run the page in PageSpeed Insights and open the “Largest Contentful Paint element” diagnostic. On most pages it is the hero image, a featured image or the first large heading. You cannot fix LCP until you know which element it is, because the fix for an image is different from the fix for text.
Break LCP into its four parts
Google splits every LCP time into four subparts. Whichever part is largest is where your time is going.
| Subpart | What it is | Typical cause when it is large | Fix |
|---|---|---|---|
| Time to First Byte (TTFB) | Until the first byte of HTML arrives | Slow hosting, no page caching, far-away server | Page caching, a CDN, better hosting |
| Resource load delay | From TTFB until the browser starts downloading the LCP image | The image is lazy-loaded, set by CSS or JavaScript, or discovered late | Put the image in the HTML, remove lazy loading, add fetchpriority="high" |
| Resource load duration | Downloading the image itself | Image too large or in an old format | Resize, compress, serve WebP or AVIF, use a CDN |
| Element render delay | From download finished to the element appearing | Render-blocking CSS and JavaScript, web fonts, client-side rendering | Inline critical CSS, defer scripts, render the main content on the server |
As a rule of thumb from Google’s guidance, most of the LCP time should be spent on TTFB and the image download. If “load delay” or “render delay” is a big share, the browser is waiting on something it should not be.
LCP fixes, in order of impact
- Never lazy-load the LCP image.
loading="lazy"on a hero image is the most common LCP mistake. WordPress skips lazy loading on the first image it detects as the hero, but page builders and plugins can override this — check the HTML. - Tell the browser it matters: add
fetchpriority="high"to the LCP image. If the image is set as a CSS background, preload it with<link rel="preload" as="image" fetchpriority="high">, or better, switch it to a normal<img>. - Make the image smaller: serve it at the size it is displayed (use
srcsetandsizes), in WebP or AVIF. A hero image rarely needs to be more than 150–200 KB. - Cut TTFB: full-page caching and a CDN usually halve TTFB on a WordPress site. If uncached TTFB is above about 800 ms, look at hosting, database queries and slow plugins.
- Remove render-blocking resources: defer non-critical JavaScript, load only the CSS the first screen needs, and self-host fonts with
font-display: swap. - Don’t build the main content with JavaScript: if a slider script or a client-side framework has to run before the hero appears, LCP waits for it. Render the first slide and the headline in the HTML.
Pro Tip: Remove the homepage slider. Sliders delay LCP (the first slide often loads through JavaScript), add CLS when slides change height, and few visitors look past the first slide. A single static hero image is faster on every metric.
For image details, see Lazy Loading, Fetch Priority, LCP and CLS and WebP vs AVIF vs JPEG, PNG and SVG.
Part 2 — INP: Make the Page Respond Quickly
The three phases of an interaction
Every click or tap has three phases. INP is the total, and each phase has different causes.
| Phase | What happens | Typical cause when slow |
|---|---|---|
| Input delay | Waiting for the browser’s main thread to be free | Other JavaScript already running: third-party tags, chat widgets, heavy page-load scripts |
| Processing duration | Running your event handlers | Too much work in one click handler, e.g. re-filtering a large product list |
| Presentation delay | Calculating layout and painting the new frame | Very large pages (thousands of DOM elements), complex CSS, forced re-layouts |
Find the slow interaction
Field data tells you INP is slow, but not which click. To find it:
- Open Chrome DevTools → Performance panel. It shows live LCP, CLS and INP as you use the page. Click menus, filters, accordions and “add to basket” buttons, and watch which interaction turns INP red.
- Record a trace of that interaction and look for long tasks (red-cornered blocks over 50 ms) on the main thread.
- For real-user detail, the attribution build of Google’s web-vitals library reports which element was clicked and which phase was slow.
INP fixes, in order of impact
- Cut third-party JavaScript. Each tag manager tag, chat widget, heatmap and social embed competes for the main thread. Remove what nobody uses, and load the rest after the page has finished loading or on first interaction.
- Break up long tasks. Split big functions so the browser can respond in between. Modern browsers support
scheduler.yield(); elsewhere,setTimeout(…, 0)does a similar job. - Show feedback first, work second. Update the button state or show a spinner immediately, then do the heavy work in the next task. INP measures the time to the next paint, so quick visual feedback counts.
- Debounce inputs. Search-as-you-type and range sliders should not run a full update on every keystroke.
- Shrink the DOM. Mega-menus with hundreds of hidden links and pages with thousands of elements make every repaint slower. Use
content-visibility: autofor long, below-the-fold sections. - Avoid layout thrashing. Reading a size (
offsetHeight) and then writing a style in a loop forces the browser to recalculate layout again and again. Batch reads, then writes.
Pro Tip: On WordPress, the usual INP culprits are page-builder animation scripts, cookie banners and several analytics tools doing the same job. Test with each plugin deactivated on a staging copy to find which one costs the most.
Part 3 — CLS: Stop the Page Jumping
Find what moves
PageSpeed Insights lists “Avoid large layout shifts” with the elements that moved. In Chrome DevTools, open the Rendering tab and turn on “Layout shift regions” — shifting areas flash blue as the page loads. Test on a phone-sized screen, where shifts are usually worse.
The common causes and their fixes
| Cause | Fix |
|---|---|
| Images and videos without size attributes | Always set width and height on <img> and <video> (or CSS aspect-ratio), so the browser reserves the space |
| Ads, embeds and iframes that load late | Give their container a fixed min-height matching the usual ad or embed size |
| Banners, notices and cookie bars inserted at the top | Overlay them (fixed position) or reserve their space from the start; never push content down after load |
| Web fonts swapping in a different size | Preload the main font file, use font-display: swap with a size-matched fallback (size-adjust), or use a system font stack |
| Animations that change size or position | Animate with transform and opacity instead of top, height or margin |
| Content loaded by JavaScript above existing content | Insert below the visible area, or show a placeholder of the final size |
CLS counts shifts during the whole visit, not just loading. Infinite scroll, “load more” buttons and accordions only count as shifts if they happen without a user action within the previous half-second, so content that expands when clicked is fine.
Pro Tip: Make sure your pages can use the browser’s back/forward cache. When someone presses Back and the page comes straight from that cache, it shows instantly with no layout shifts. PageSpeed Insights flags pages that block it, often because of
Cache-Control: no-storeor unload event handlers.
A 30-Minute Diagnosis Routine
- Open Search Console → Core Web Vitals. Note which metric fails, on mobile or desktop, and which group of URLs.
- Pick one example URL from the worst group and run it in PageSpeed Insights. Note the real-user values and the lab diagnostics for the failing metric.
- For LCP: find the LCP element and the largest of its four subparts. For INP: reproduce the slow click in the DevTools Performance panel. For CLS: switch on layout shift regions.
- Fix the template, not just the URL, then click “Validate fix” in Search Console and check again after 28 days.
Sources
- web.dev — Optimize Largest Contentful Paint (LCP subparts)
- web.dev — Optimize Interaction to Next Paint (interaction phases)
- web.dev — Optimize Cumulative Layout Shift
- web.dev — INP becomes a Core Web Vital on 12 March 2024
- web.dev — Optimize resource loading with the Fetch Priority API
- web.dev — Back/forward cache