

Last Updated: 6 June 2026 | Originally Published: 19 October 2025
Most local businesses checking their rankings are answering the wrong question. Position three for “plumber Chicago” is a data point. Whether that position is generating phone calls, direction requests, and paying customers is the answer that determines whether your local SEO investment is working.
The measurement gap is consistent across local business SEO: practitioners track rankings and traffic while the metrics that connect to revenue — call volume by source, direction requests by location, conversion rate from local organic sessions — go unmeasured. Without those connections, budget decisions are made on assumption rather than evidence, and the channels producing the best return are indistinguishable from those producing nothing.
Local SEO analytics isn’t regular SEO analytics applied to a smaller geography. It requires data from Google Business Profile, call tracking, review platforms, and citation directories alongside website analytics — and it requires those data streams to be read in combination, not in isolation. This cluster goes deeper than the measurement overview in our Local SEO Mastery guide covers. You’ll get the metric framework, dashboard architecture, tool stack, and reporting structure that turns local search data into actionable decisions.
Post Summary:
- Local SEO analytics requires seven distinct data sources — rankings, GBP Insights, organic traffic, call tracking, reviews, citations, and conversion events — none of which tells the complete story alone
- GBP actions (calls, direction requests, website clicks) are the primary revenue-connected metrics — views without actions indicate a listing that needs optimisation, not more traffic
- Rankings vary by neighbourhood and device — self-checking produces misleading data; location-specific tracking tools are required for accurate position data
- The 80/20 rule applies to metrics: five to seven core KPIs connected to revenue generate more useful insight than twenty vanity metrics that don’t
- Multi-location businesses must segment every metric by individual location — aggregate data masks underperforming sites until the problem has compounded
- Google Looker Studio is the correct starting point for dashboard building — free, integrates all Google data sources, and expandable as analytics maturity grows
- What is SEO analytics for local search? It’s the systematic connection between search visibility data and offline revenue outcomes — not ranking reports
Table of Contents
ToggleWhat Is Local SEO and Why Does Measuring It Require a Different Approach
Local SEO is the discipline of optimising a business’s online presence to appear in geographically relevant search results — primarily Google’s local pack (the map results), Google Maps, and local organic results below the map. For a business serving customers in a specific city, neighbourhood, or service area, local SEO determines whether those customers find the business or a competitor when they search for the relevant service.
What makes measuring local SEO different from measuring broader SEO is the multi-source nature of local search visibility. A national e-commerce site can be measured almost entirely through website analytics. A local business generates meaningful customer interactions across Google Business Profile (calls, direction requests, map views), review platforms (Yelp, Google reviews, industry directories), citation sources, and its website simultaneously. Measuring only the website misses the majority of how local customers actually interact with the business before making contact.
The second distinguishing factor is offline conversion. Most local business transactions happen in person or by phone — not through a website checkout. A plumber’s website doesn’t record a sale when someone calls and books an emergency repair. A restaurant’s analytics don’t capture a table booking made by phone after a Google Maps search. Connecting online visibility data to those offline outcomes requires deliberate measurement infrastructure that standard website analytics doesn’t provide by default.
The third factor is geographic granularity. National SEO tracks one set of rankings. Local SEO requires tracking rankings from specific coordinates within a service area — because a business might rank second in the city centre and twelfth in the suburbs, and aggregate ranking data obscures that variation entirely.
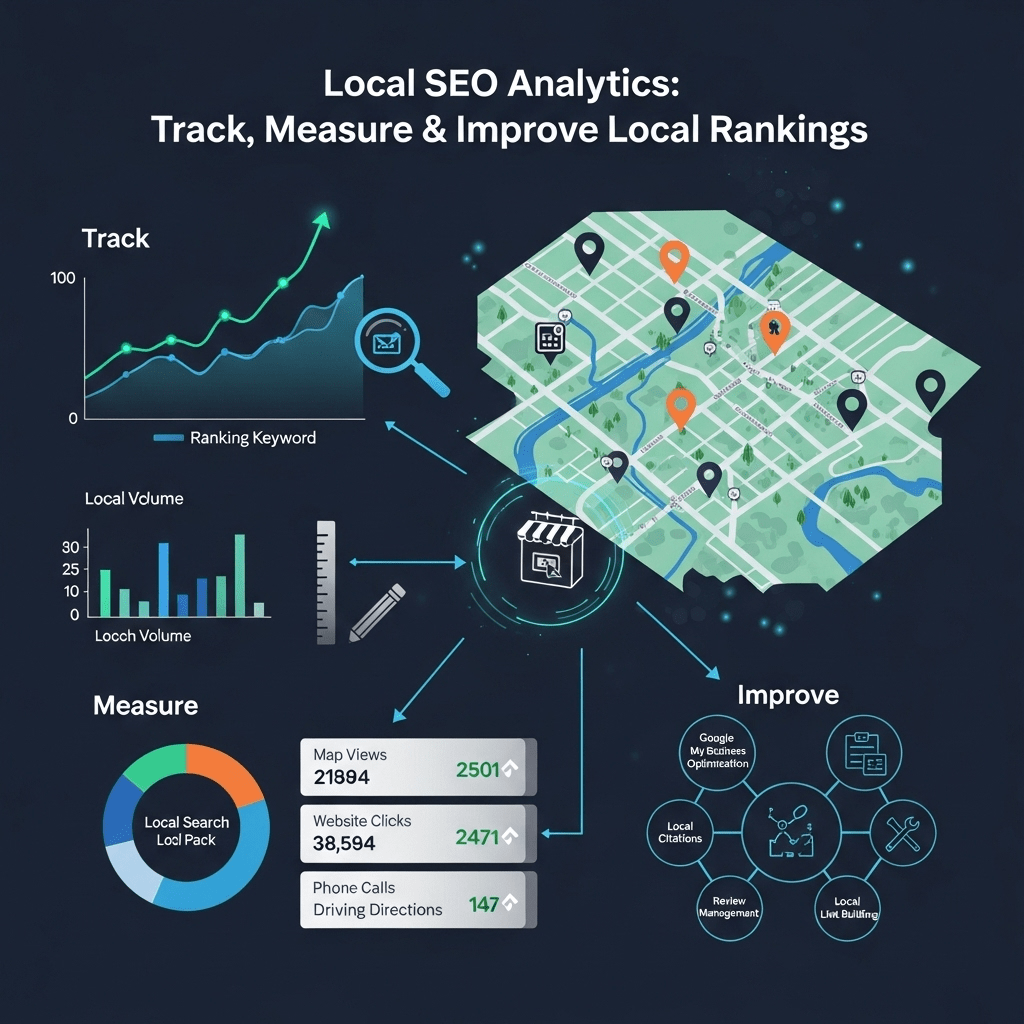
Local SEO Analytics:
Track, Measure & Improve
Local Rankings in 2026
The data, metrics, ranking factors and tool stack behind local search performance — verified from BrightLocal, Whitespark, Moz, Google and Visionary Marketing.
Verified statistics from Digital Applied, On The Map Marketing, WiserReview, BrightLocal, and Visionary Marketing (2025–2026).
Sources: Whitespark Local Search Ranking Factors 2026, BrightLocal 2026, Digital Applied 2026, Visionary Marketing 2026.
Local Pack Ranking Factor Categories
Weight of each category — Whitespark 2026 (47 experts, 187 factors)
Consumer Actions After Local Search
% of local searchers taking each action within 24–48 hours
GBP Action Rate by Profile Completeness
Relative action rate index — complete vs incomplete profiles
Local Search Intent Growth (2019–2026)
% of all Google searches with local intent
Survey of 47 top local SEO experts evaluating 187 factors. Published November 2025, triangulated with BrightLocal's Local Algorithm reference.
GBP Signals
Primary category, business title keywords, profile completeness, photo count, post frequency, Q&A activity
On-Page Signals
Location keywords in title tags, H1s, NAP on page, localised content quality, service area pages
Review Signals
Review count, average rating, velocity (new reviews per week), owner response rate, sentiment
Link Signals
Inbound links from local/regional sites — businesses with local backlinks rank 14% higher in Local Pack
Behavioural Signals
Click-through rate from local pack, GBP website clicks, direction requests, call actions
Citation Signals
NAP consistency across directories — NAP consistency improves local rankings by avg 23% (Moz/BrightLocal). Citations now at 7% weight, down from 13% in 2020
Track these in this priority order. Vanity metrics (impressions, follower counts) are excluded — every metric here has a direct revenue connection.
| # | Metric | Source | Revenue Connection | Priority |
|---|---|---|---|---|
| 1 | GBP Actions Calls, directions, website clicks | GBP Insights | Direct leads and foot traffic — most immediate revenue signal | Revenue |
| 2 | Phone Calls by Source Attributed to channel/page | CallRail / call tracking | Majority of local service conversions — invisible without tracking | Revenue |
| 3 | Local Pack Rankings From customer coordinates | Local Falcon / BrightLocal | Top 3 capture 44% of clicks — position directly correlates with lead volume | Revenue |
| 4 | Organic Local Traffic By city and landing page | Google Analytics 4 | Conversion rate from location pages — identifies underperforming pages | Growth |
| 5 | Review Velocity & Distribution By platform and geography | GBP / BrightLocal | 50+ reviews = 266% more leads; geographic distribution validates service areas | Growth |
| 6 | Citation Consistency Score NAP accuracy across directories | Moz Local / BrightLocal | Consistency improves local rankings by avg 23% — target 95%+ score | Foundation |
| 7 | Conversion Events Forms, bookings, click-to-call | Google Analytics 4 | Closes the loop between search visibility and identifiable leads | Foundation |
Sources: Visionary Marketing 2026, Digital Applied 2026, ReviewTrackers 2026, Moz Local Search Ranking Factors 2026.
More Clicks for 50+ Reviews
GBPs with 50+ reviews win 4.4× more clicks than profiles with under 5 reviews at the same ranking position.
Lead Volume Rise at 100 Reviews
GBPs crossing the 100-review threshold saw lead volume rise 31% year-over-year — vs 12.4% dataset-wide growth.
Consumers Read Reviews in 2026
87% of consumers read online reviews before choosing a local business. Businesses below 4.0 stars face a measurable conversion penalty.
More Reviews When You Respond
Businesses that respond to reviews receive 12% more reviews on average and a 0.12 higher average star rating.
The free stack covers the majority of measurement needs. Add paid tools only for the capabilities free tools can't provide.
GBP Insights
Actions, views, search queries direct from Google. Most accurate GBP data source because it is the source.
FreeGoogle Analytics 4
Local traffic segmentation by city and landing page. Conversion event tracking for forms, click-to-call, bookings.
FreeGoogle Search Console
Keyword-level impression and CTR data. Local query performance. Position data for organic local results.
FreeGoogle Looker Studio
Unified dashboard connecting all Google data sources. Automated email reporting. Free and expandable.
FreeLocal Falcon
Grid-based rank tracking from customer coordinates. Heat map of ranking performance across service area.
From £25/moBrightLocal
Multi-location rank tracking, citation auditing, review monitoring across 70+ platforms in one dashboard.
From £33/moCallRail
Call attribution by source and landing page. Closes the offline conversion gap for phone-first businesses.
From £40/moMoz Local
Citation distribution to 15+ aggregators. NAP consistency score. Duplicate listing detection and cleanup.
From £99/yraiseojournal.net · by AI-SEO Design Team · Local SEO Analytics Visual Guide 2026 · Data: Whitespark, BrightLocal, Visionary Marketing, Digital Applied, On The Map Marketing, WiserReview, ReviewTrackers, Moz (2025–2026)
The Seven Local SEO Metrics That Actually Connect to Revenue
Tracking everything produces analysis paralysis. Tracking the wrong things produces confident decisions built on irrelevant data. The seven metrics below connect directly to how local customers find, evaluate, and choose a local business.
GBP actions — calls, direction requests, and website clicks generated from the Google Business Profile — are the primary revenue-connected metrics in local SEO. A direction request indicates a customer is navigating to the premises. A phone call from GBP is a direct lead. These are the metrics that pay bills; profile views and search impressions are the metrics that precede them. The action rate (actions divided by views) is the diagnostic figure — a low action rate against high views indicates a listing that isn’t converting visibility into intent, which points to photo quality, rating, or profile completeness as the lever to adjust.
Local pack rankings measured from actual customer locations, not self-checked from the business owner’s device or office. Rankings are personalised — your search history, device, and physical location all affect the results Google shows you. Checking your own rankings produces data about what you see, not what your customers see. Tools that check rankings from specified coordinates across a grid of locations within the service area produce the accurate, customer-perspective data that ranking decisions require.
Organic local traffic segmented by city and landing page in Google Analytics 4. Which location pages attract traffic and which are functionally invisible? Which service areas generate sessions that convert to contact events and which generate sessions that bounce? These segmentations reveal where content investment is returning ranking performance and where pages need strengthening.
Phone calls attributed by source using call tracking numbers assigned to each traffic channel and each location page. Without call tracking, phone leads — which represent the majority of conversions for most local service businesses — are invisible in analytics. A plumber generating forty calls per month from local organic search and twenty from their GBP listing has a different optimisation priority than one generating five from organic and fifty from GBP.
Review velocity and geographic distribution across Google and relevant industry platforms. Review volume and rating are local pack ranking factors — and for service area businesses, review geography is the primary mechanism Google uses to verify claimed service territories. Tracking reviews by platform, by average rating trend, and by the geographic distribution of reviewer locations provides both ranking intelligence and reputation management data.
Citation consistency score measured across the business’s citation profile using a tool that checks NAP accuracy across major directories. A consistency score below 90% indicates citation noise that weakens local entity signals. Tracking this score quarterly catches degradation before it affects rankings.
Conversion events including form submissions, appointment bookings, and click-to-call events set up as GA4 conversion goals on location pages specifically. These close the measurement loop between search visibility and customer intent — the point at which an anonymous website visitor becomes an identifiable lead.
Pro Tip: The action rate on your GBP profile — total actions divided by total views — is the single fastest diagnostic for local listing performance. A rate below 5% on a profile with substantial views indicates a conversion problem at the listing level: photos, rating, or completeness. Fix that before investing further in ranking improvement — ranking higher with a 3% action rate generates proportionally more ignored impressions, not more customers.
What Is the Best Local SEO Tool: Building the Right Stack Without Overspending
The honest answer to “what is the best local SEO tool” is that no single tool covers all seven metrics above. The right stack combines free tools for foundational measurement with one or two paid tools for the capabilities free tools don’t provide.
The foundational free stack covers the majority of measurement needs for most local businesses. Google Business Profile Insights provides GBP views, search queries, and action data directly from Google — the most accurate source for that data because it is the source. Google Analytics 4 provides website traffic, geographic segmentation, and conversion event tracking. Google Search Console provides keyword-level impression and click data, CTR by query, and the position data that connects specific search terms to organic traffic. Google Looker Studio connects all three into a single dashboard with automated reporting at no cost.
The gap the free stack doesn’t fill is accurate local pack ranking tracking from customer locations. This requires a paid tool. Local Falcon’s grid-based rank checking — which checks rankings from a configurable grid of coordinates across the service area and produces a heat map of ranking performance by location — is the most visually useful solution for understanding geographic ranking distribution. BrightLocal provides broader local SEO management including citation auditing, review monitoring across seventy-plus platforms, and multi-location rank tracking in a single platform. For businesses managing five or more locations, BrightLocal’s consolidated reporting justifies the cost; for single-location businesses, Local Falcon plus the free stack covers most requirements.
Call tracking is the paid capability most local businesses underinvest in relative to its measurement value. CallRail’s dynamic number insertion attributes calls to specific traffic sources and landing pages, closing the measurement gap between online visibility and offline conversion. Without call tracking, any business where customers primarily contact by phone is making optimisation decisions with half the conversion data missing.
| Tool | Category | Cost | Primary Value |
|---|---|---|---|
| Google Business Profile Insights | GBP performance | Free | Action and view data direct from source |
| Google Analytics 4 | Website traffic | Free | Local traffic segmentation and conversions |
| Google Search Console | Rankings and queries | Free | CTR, impressions, keyword-level data |
| Google Looker Studio | Dashboard | Free | Unified reporting across Google sources |
| Local Falcon | Rank tracking | From £25/mo | Grid-based geographic rank visualisation |
| BrightLocal | Multi-location management | From £33/mo | Citations, reviews, rankings consolidated |
| CallRail | Call tracking | From £40/mo | Phone lead attribution by source |
What Is SEO Analytics for Local Search: Building a Dashboard That Drives Decisions
SEO analytics for local search is the systematic process of connecting search visibility data — rankings, impressions, GBP views — to the business outcomes that matter: calls, visits, bookings, and revenue. A ranking report is not local SEO analytics. A dashboard showing ranking position alongside call volume, direction requests, and conversion events, segmented by location and tracked over time — that is local SEO analytics.
The dashboard architecture that works for most local businesses follows five sections. The overview section contains four scorecard metrics with month-over-month comparison: total GBP actions, total phone calls from organic search, local organic sessions, and average GBP rating. These four numbers, visible at a glance, answer the question “is local SEO working this month?”
The rankings section tracks local pack positions for the top five to ten keywords from customer-representative locations, with directional indicators showing week-over-week movement. Include a competitor comparison column — your ranking is only meaningful relative to the businesses that appear above and below you.
The traffic section shows local organic sessions segmented by city and by landing page. Bar charts comparing location page performance identify which pages are pulling their weight and which need content investment. The device split (mobile versus desktop) in this section flags mobile usability issues before they become ranking problems — local search is overwhelmingly mobile, and a high mobile bounce rate on location pages indicates a page experience problem.
The conversions section connects online metrics to offline intent: phone calls by source, form submissions from local traffic, direction requests, and any appointment booking events. This section is where the revenue connection lives — it’s the section that justifies continued investment to any stakeholder who doesn’t think in ranking positions.
The reputation section tracks review volume added this month, current average rating, review response rate, and a geographic distribution note for service area businesses. Declining review velocity is an early warning signal that requires action before it affects local pack ranking.
A multi-location dental practice in Austin implemented this dashboard architecture across five locations using BrightLocal for rank tracking and CallRail for call attribution. The data revealed that their lowest-visibility location (West Austin, 95 monthly GBP views) was in the highest-demand demographic area — the gap between potential and performance was a review deficit of thirty-plus reviews compared to competitors, not a content or technical issue. Targeted review generation for that location alone moved it from outside the local pack to position two within four months. Without location-level segmentation, that opportunity would have been invisible in aggregate data. The unexpected friction: getting the practice manager at that location to implement the review request process consistently required three check-in calls and a simplified one-page process document — the analytics were immediately clear; the operational change was slower.
Tracking Rankings Accurately: Why Self-Checking Produces Misleading Data
The most consistent technical mistake in local SEO measurement is checking your own rankings from your own device or office and treating the result as representative of what customers see.
Google personalises search results based on your search history, your device, your physical location, and your past interactions with businesses in the results. When a business owner searches their primary keyword from their own computer, they’re seeing a result influenced by the fact that they’ve visited their own website hundreds of times, they’re physically located at or near the business address, and their device history associates them with that business category. The ranking they see is almost certainly higher than what the average customer in their market sees.
The correct method for rank tracking uses tools that send anonymised queries from specified geographic coordinates, stripping personalisation signals entirely. For local pack rankings specifically, grid-based tracking that checks position from multiple coordinate points across the service area — every half-mile, every mile, or every neighbourhood boundary depending on the precision required — produces a geographic heat map that shows exactly where in the service area the business ranks well and where it falls below the local pack threshold.
This data is operationally useful in a way that a single position number never is. A bakery ranking second in the city centre but eighth in the suburb three miles away has a specific, targeted optimisation problem. A plumber ranking first downtown but absent from the local pack in four of their claimed service territory postcodes has a service area verification problem. Both insights are invisible without coordinate-based rank tracking.
Frequently Asked Questions About Local SEO Analytics
What is local SEO and how is measuring it different from regular SEO?
Local SEO is the practice of optimising a business’s online presence to appear in geographically relevant search results — primarily Google’s local pack, Google Maps, and local organic results. Measuring it differs from regular SEO because local search performance is distributed across multiple data sources beyond the website: Google Business Profile, review platforms, citation directories, and call tracking. Revenue outcomes in local search also occur predominantly offline — by phone or in person — requiring call tracking and direction request data to complete the measurement picture. For the complete local SEO framework these analytics measure, the Local SEO Mastery guide covers each component in sequence.
What is the best local SEO tool for tracking performance?
No single tool covers all local SEO measurement requirements. The most cost-effective starting stack combines Google Business Profile Insights, Google Analytics 4, and Google Search Console — all free — with Local Falcon for coordinate-based rank tracking and CallRail for phone lead attribution. For businesses managing five or more locations, BrightLocal consolidates citation management, review monitoring, and rank tracking in a single platform that justifies its cost against managing those functions separately. The correct tool selection depends on location count, budget, and whether call volume or ranking accuracy is the primary measurement gap to close.
What is SEO analytics and what should it produce for a local business?
SEO analytics is the systematic measurement of how search visibility translates into website traffic, customer interactions, and business outcomes. For a local business, it should produce seven connected data streams: GBP actions, location-specific rankings, local organic traffic by city and page, phone calls by source, review velocity and distribution, citation consistency score, and on-page conversion events. The output of local SEO analytics is not a ranking report — it’s a decision framework that tells you which locations need attention, which channels are generating revenue, and where the next optimisation investment will produce the highest return.
How do multi-location businesses track analytics for each location separately?
Each location requires its own Google Business Profile with separate Insights data, a unique phone tracking number for call attribution, a dedicated location page in website analytics with its own conversion tracking, and individual rank tracking configured from coordinates within that location’s service territory. BrightLocal and similar multi-location platforms consolidate these per-location data streams into a single dashboard with location-level filtering. The critical operational rule: never review aggregate data across all locations without drilling into individual location performance — aggregate data consistently masks underperforming sites until the problem has compounded significantly.
Local SEO Analytics: Your Next Step
The businesses generating the highest return from local search investment aren’t necessarily the ones with the strongest technical SEO or the most content — they’re the ones who know which metrics are moving, why they’re moving, and what to adjust when they aren’t. That clarity comes from measurement infrastructure, not instinct.
The fastest path to useful local SEO analytics for most businesses is completing the free stack first: GBP Insights reviewed weekly, GA4 with conversion events configured for phone clicks and form submissions, Search Console filtering for local query performance. Those three tools, used consistently, provide the majority of the insight needed to make better optimisation decisions — before any paid tool investment is justified.
Once the free stack is producing consistent data, add coordinate-based rank tracking for accurate position data from customer locations, then call tracking to close the offline conversion gap. Build the five-section dashboard in Looker Studio. Review it monthly with a structured agenda: what improved, what declined, what anomaly needs investigation, what action does the data suggest for the next thirty days.
The complete strategic framework that these analytics measure — covering GBP optimisation, citation building, local link acquisition, and review management — is in the Local SEO Mastery guide.
Open Google Business Profile Insights now. Check your action rate for the last 30 days. That number — actions divided by views — is your first diagnostic data point and your starting optimisation priority.
References
Google. “Google Business Profile Performance.” Google Business Profile Help, 2024. https://support.google.com/business/answer/9270354 Supports: GBP Insights metrics, action categories, and search query data methodology.
Google. “Google Analytics 4 — Set Up Analytics.” Google Analytics Help, 2024. https://support.google.com/analytics/answer/9304153 Supports: GA4 configuration for local traffic segmentation and conversion event tracking.
Google Search Central. “Search Console Overview.” Google, 2024. https://developers.google.com/search/docs/monitor-debug/search-console-start Supports: Impression, click, and CTR data for local keyword performance measurement.
BrightLocal. “Local Consumer Review Survey.” BrightLocal, 2024. https://www.brightlocal.com/research/local-consumer-review-survey/ Supports: Review signals as local pack ranking factors and consumer trust data.
Whitespark. Local Search Ranking Factors.” Whitespark, 2024. https://whitespark.ca/local-search-ranking-factors/ Supports: Review velocity, citation consistency, and GBP completeness as ranking factor weightings.
Google. “About Google Business Profile Insights.” Google, 2024. https://support.google.com/business/answer/9918094 Supports: GBP action rate methodology and direction request data interpretation.
Moz. “Local SEO: A Simple but Complete Guide.” Moz, 2024. https://moz.com/learn/seo/local Supports: NAP consistency scoring methodology and citation audit framework.